太平洋-北美遥相关型(PNA)是北半球中纬度变率的主要模态之一,对北美的气候变化有重要影响。月平均或季节平均的PNA通常被认为是对热带海温异常的稳定响应,其与ENSO现象的联系已被广泛研究。在这些时间尺度上,由于ENSO的不对称加热作用,冬季平均的PNA在El Niño冬季往往强于La Niña冬季。然而关于ENSO如何调制季节内太平洋-北美遥相关型(ISPNA)的研究相对较少,且ENSO影响季ISPNA变率的具体机制仍不明确。
王会军院士团队的周放副教授及其硕士研究生简圣华等研究发现:(1)去除冬季平均PNA的干扰后La Niña冬季的ISPNA比El Niño冬季的强度更强,周期更长(图1),其差异主要出现在15-70天的周期内。(2)ISPNA与MJO之间存在锁相关系,即正(负) ISPNA事件的峰值(谷值)更倾向于出现在MJO对流位于西太平洋(印度洋)上空时,即MJO位相7-8(2-3)位相(图2),这表明ISPNA的偏态可能主要由MJO控制。造成这种偏态主要原因在于La Niña冬季热带西太平洋至澳大利亚以东洋面的MJO对流强度偏强,且MJO向东传播较慢,导致La Niña年冬季ISPNA强度偏强、周期偏长。(3)热带和中纬度地区是ISPNA的两个主要波活动的区域,其中由MJO激发的从热带向北传播到ISPNA副热带太平洋中心的热带异常Rossby波活动进一步阐明了ISPNA与MJO之间的因果关系(图3),即MJO的传播快慢和强弱主导了ISPNA的周期和强度。
本工作得到了国家自然科学基金基础科学中心项目(42088101)的第一资助,相关成果发表于期刊《Geophysical Research Letters》。

Figure 1. (a) Regression pattern of the monthly mean stream function anomaly at 300 hPa (unit: 1×10⁶ m2s-1) onto the monthly PNA index. (b) Power spectra of the NDJFM daily PNA index. The red, blue, and dark grey dashed curves are the red noise spectra corresponding to the daily PNA index spectra during the El Niño winters, La Niña winters, and all of the winters, respectively. (c) Similar to (b) but for the mean power spectrum for the daily PNA index during NDJFM in each year. (d–e) Temporal evolution of the original daily PNA index (black solid line), 15–70-day filtered PNA index with the winter mean retained (green dashed line), and the 15–70-day filtered PNA index with the winter mean removed (green solid line) in the (d) 2010/11 winter and (e) 2015/16 winter. (f–g) Composite difference of the stream function anomaly at 300 hPa (unit: 1×10⁶ m2s-1) on day 0 between the positive ISPNA and negative ISPNA in the (f) El Niño winters and (g) La Niña winters. (h–i) Temporal evolution of the composite daily PNA index associated the positive and negative ISPNA events in the El Niño winters (red box) and La Niña winters (blue box) with the winter mean (h) retained and (i) removed. The grey meshes in (a) and (f–g) denote the significant stream function anomalies above the 99% confidence level based on two-tailed Student’s t-tests. The error bars in (h–i) denote the index spread, i.e., two standard deviations about the mean PNA index.
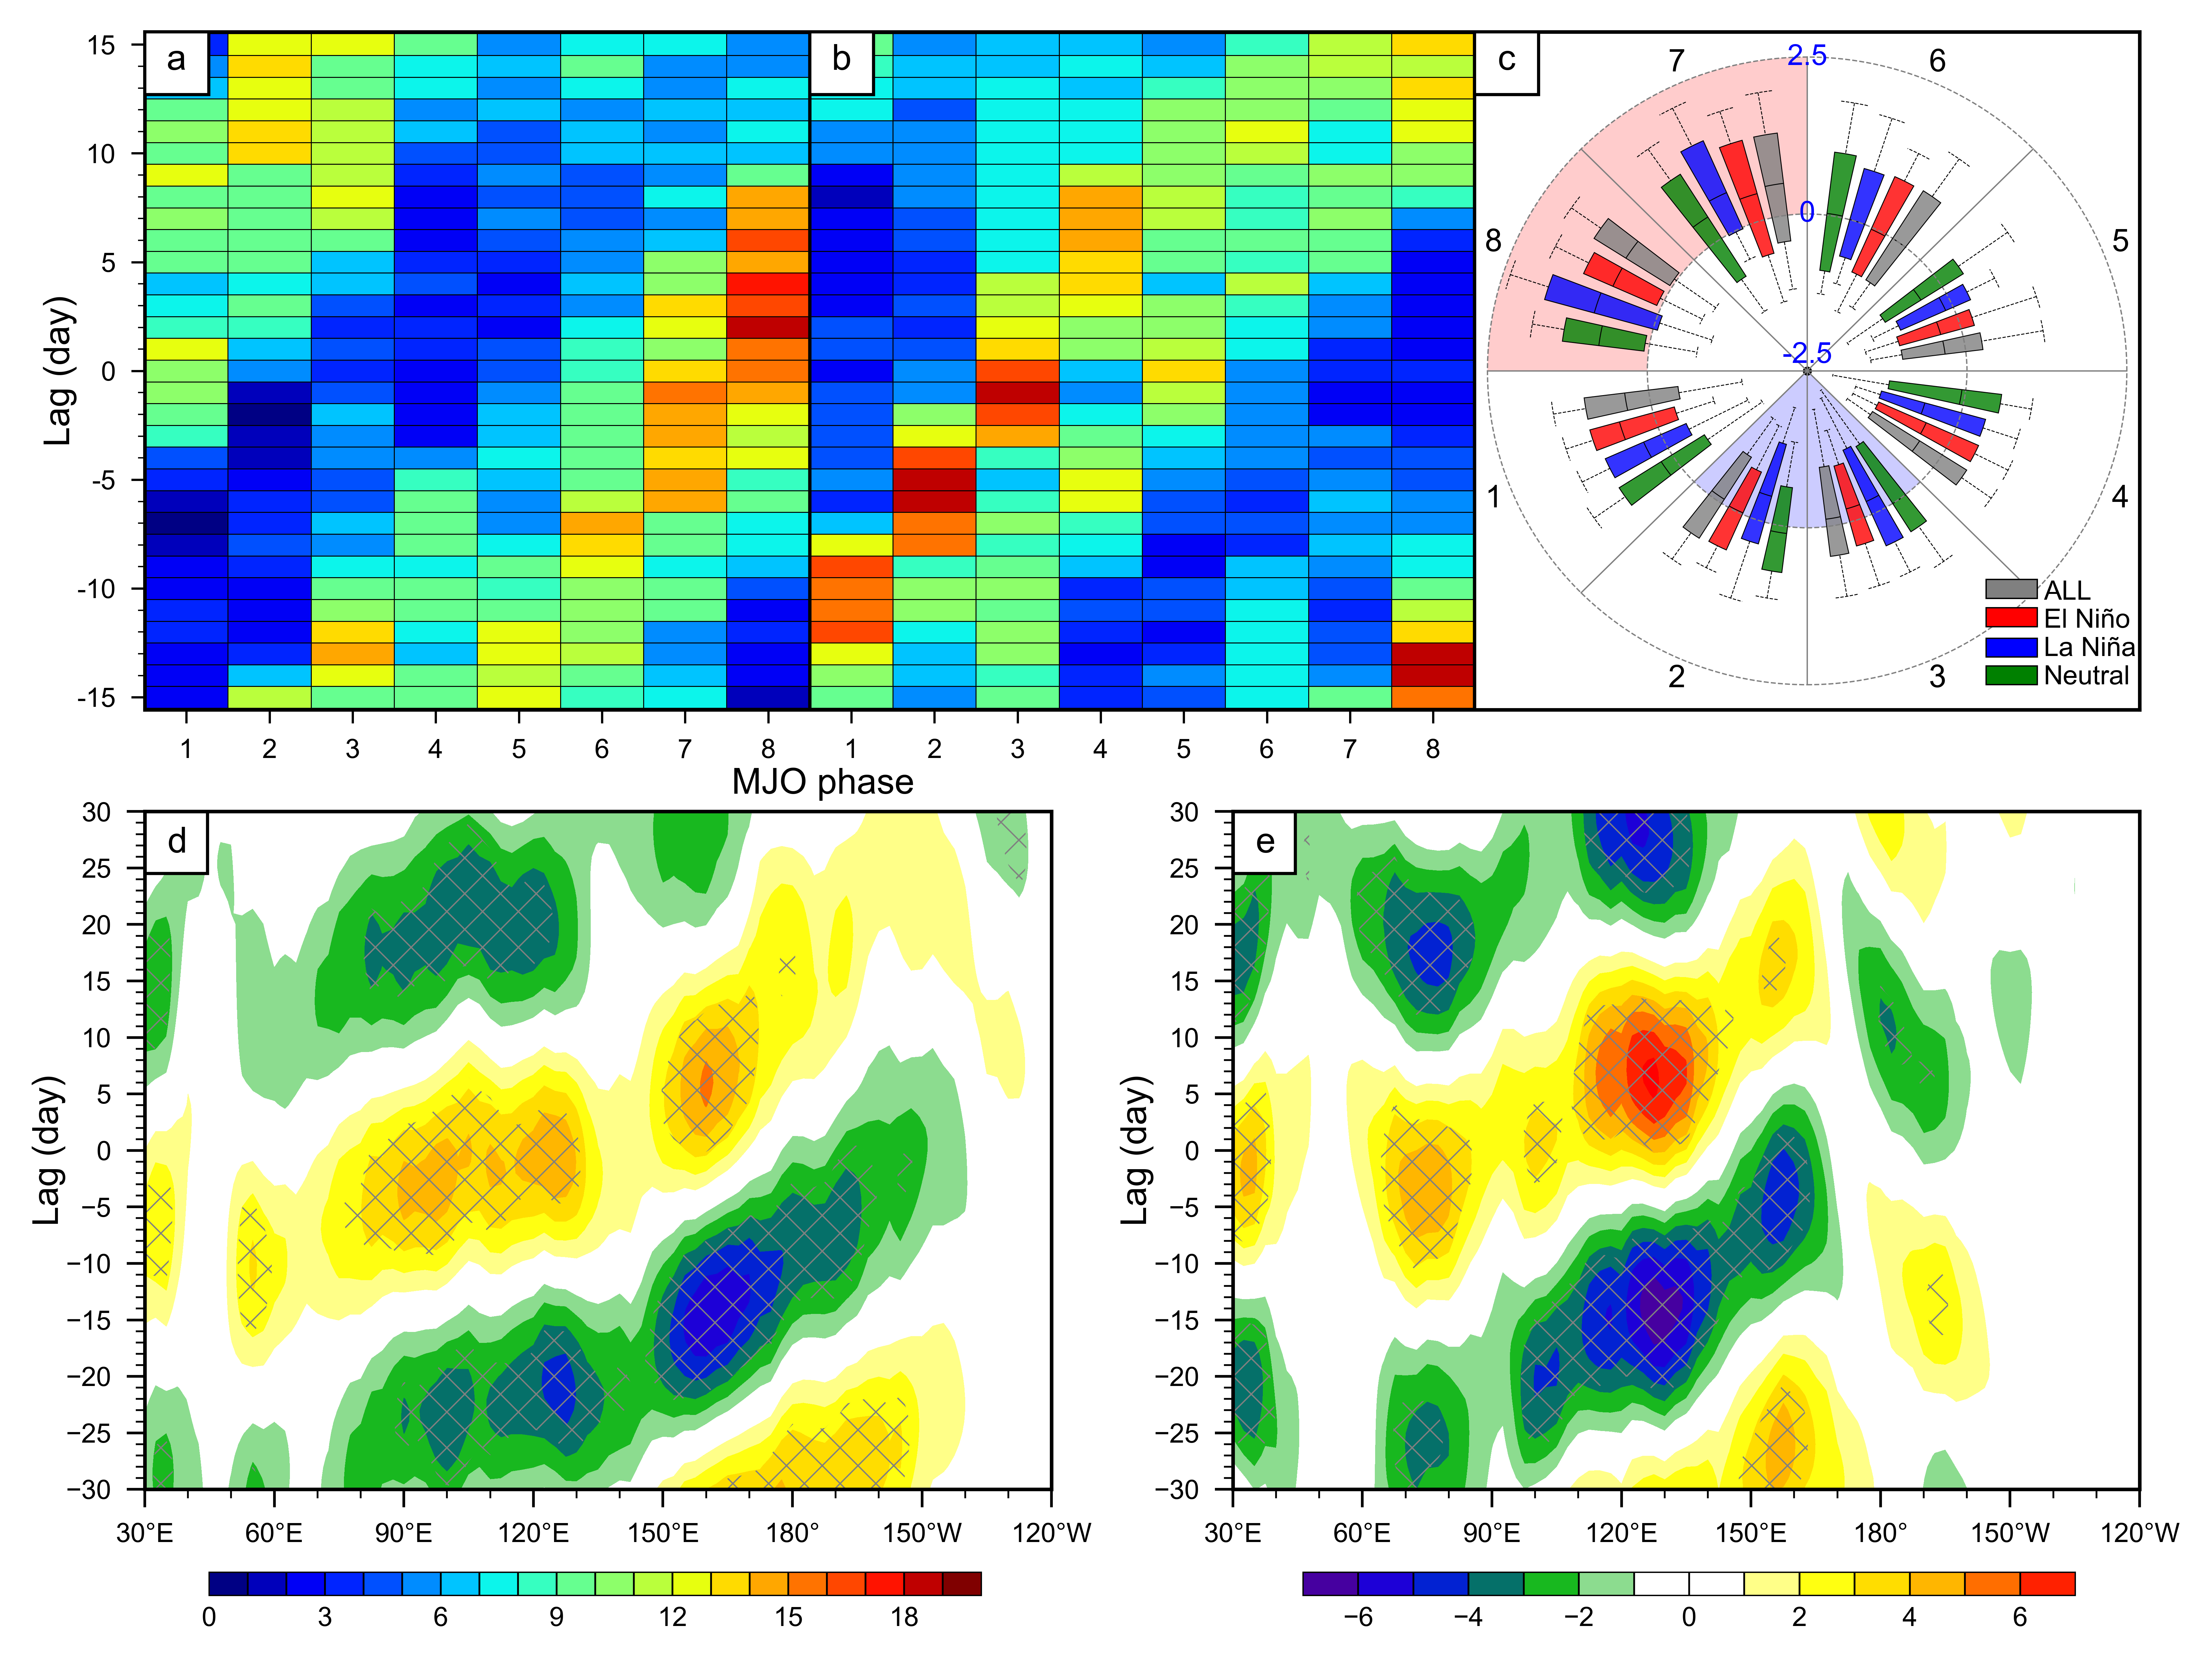
Figure 2. (a–b) Filled gridded cells for the percentages (unit: %) of the (a) positive and (b) negative 15–70-day bandpass-filtered PNA index values around its peak and valley from day −15 to day +15 during the eight phases of the MJO. (c) PDFs of the 15–70-day bandpass-filtered PNA index during the eight phases of the MJO in the (red box) El Niño, (blue box) La Niña, (green box) neutral, and (grey box) all of the winters. The values on the box plots are the 10th (lower bound), 25th (lower quartile), median, 75th (upper quartile), and 90th (upper bound) percentiles. (d–e) Longitude-time cross section of the composite difference between the OLR anomalies (unit: Wm-2) during the positive ISPNA and negative ISPNA averaged over 20°S–0° from the 30-day lead to the 30-day lag during the (d) El Niño winters and (e) La Niña winters. The grey meshes in (d–e) denote the significant OLR anomalies above the 99% confidence level based on two-tailed Student’s t-tests.

Figure 3. (a–b) Composite differences in the stream function at 300 hPa (blue-red shading and contours, unit: 1×10⁶ m2s-1) and OLR (green-yellow shading, unit: Wm-2) anomalies between the positive 15–70-day bandpass-filtered PNA index exceeding the 10th percentile for the entire time period of the index in MJO phases 7–8 and the negative 15–70-day bandpass-filtered PNA index below the 90th percentile for the entire time period of the index in MJO phases 2–3 in the (a) El Niño winters and (b) La Niña winters. (c–d) Similar to (a–b), respectively, but for the RWS (shading, unit: 1×10⁻¹⁰ s-2) and T-N flux (vectors above 1 m2s-2) anomalies. (e-f) The vertical structure RWS (shading, unit: 1×10⁻¹⁰ s-2) and stream function (contours, unit: 1×10⁶ m2s-1) along the green lines in (c-d). Latitude-time cross section of composite differences in the RWS (shading, unit: 1×10⁻¹⁰ s-2), stream function (contours, unit: 1×10⁶ m2s-1) and T-N flux (vector, unit: m2s-2) anomalies between positive ISPNA and negative ISPNA averaged over 170°E–170°W from the 15-day lead to the 15-day lag during the (g) El Niño winters and (h) La Niña winters. The grey meshes in denote the significant stream function and OLR anomalies above the 99% confidence level based on two-tailed Student’s t-tests.
相关文章:
Zhou, F., Jian, S., Liu, M., & Wang, R. (2024). Madden‐Julian Oscillation contributes to the skewed intraseasonal PNA in El Niño and La Niña winters. Geophysical Research Letters, 51, e2024GL111119. https://doi.org/10.1029/2024GL111119