西伯利亚高压(SH)作为北半球冬季欧亚大陆最主要的气候系统之一,与东亚冬季风的变化乃至寒潮的爆发密切相关,其季节内变化特征一直是东亚冬季气候研究的重要内容,也是预测冬季气候灾害的关键。ENSO作为热带太平洋–大气耦合系统中最强的年际变率信号在季节-年际尺度上对SH的影响已经在很多研究成果中被证实。鉴于已有的研究支持ENSO可以作为外部缓变的强迫背景,对季节内变率产生显著的调制作用,在ENSO冷暖事件的不同背景下,SH在冬季的季节内变率是否会存在显著的特征差异?ENSO调制SH季节内变率的机制又是什么?近期,王会军院士团队的周放副教授及其硕士研究生黄闽同学等,揭示了ENSO通过MJO调制SH季节内周期的特征和机理,相关成果发表于期刊《Environmental Research Letters》。
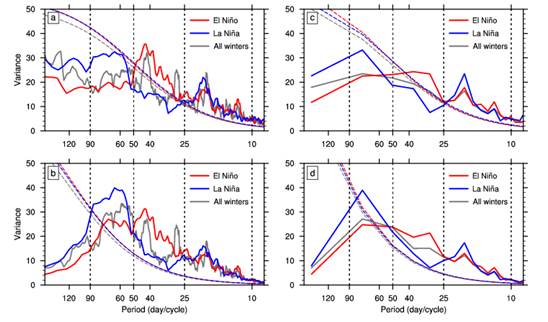
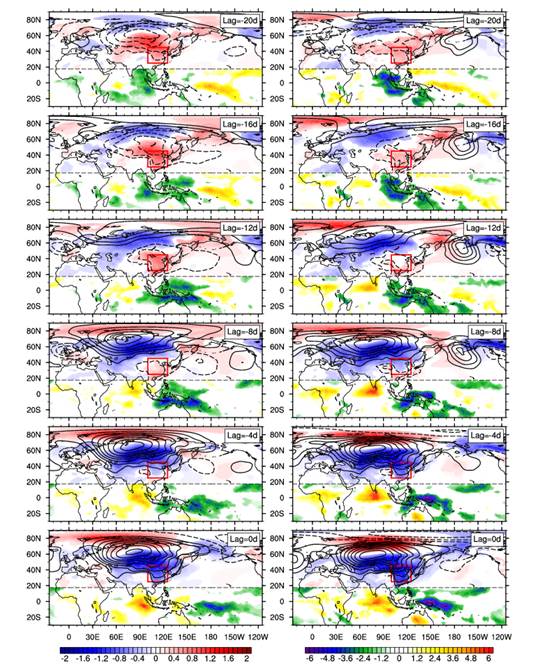
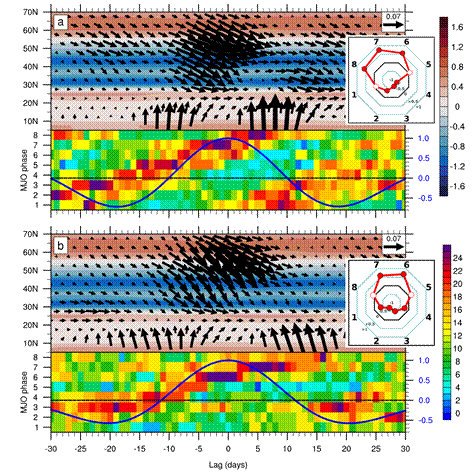
该研究发现:(1)不同ENSO事件背景下,SH在北半球冬季呈现出不同的季节内周期特征(图1),El Niño冬季呈现出25-50天的周期,La Niña冬季呈现出50-90天的周期。(2)造成这种周期差异的主要原因在于厄尔尼诺年的MJO传播速度更快(图2),随着MJO的向东传播,来自热带的异常信号北传并影响中高纬环流场,使得El Niño背景下SH的演变明显快于La Niña背景,从而导致El Niño背景下的SH季节内周期更短。(3)通过与SH演化相关的对流层上层波活动能够证实ENSO通过MJO调制SH季节内周期的因果关系以及影响途径(图3)。波通量表明SH峰值时期主要受到中高纬上游异常信号的影响,而当SH发生强弱位相转变时(对应MJO第4–6位相和8–2位相),MJO激发的热带异常Rossby波则成为了主要因素,MJO的传播快慢主导了SH季节内周期的快慢。
本工作得到了国家自然科学基金基础科学中心项目(42088101)的第一资助。

Figure 1. (a) Power spectra of the NDJFM SH index. The red, blue, and dark grey dashed curves are the red noise spectra corresponding to the SH index spectra during the El Niño winters, La Niña winters, and all of the winters, respectively. (b) Similar to (a) but for the SH index obtained by removing the interannual variability and synoptic fluctuations. (c) Mean power spectrum for the SH index during NDJFM in each year. The red, blue, and dark grey dashed curves are the red noise spectra corresponding to the SH index spectra during the El Niño winters, La Niña winters, and all of the winters, respectively. (d) Similar to (c) but for the SH index obtained by removing the interannual variability and synoptic fluctuations.

Figure 2. Evolution patterns of the SLP anomalies (contours, interval of 50 Pa; the zero contours are omitted), SAT anomalies (blue-red shading, unit: °C), and OLR anomalies (green-yellow shading, unit: W/m2) regressed on the 25–90-day bandpass-filtered SH index during the El Niño (left panel) and La Niña (right panel) winters (from Day –20 to 0). Only the regressed SAT anomalies and OLR anomalies confident at the 95% level based on the Student’s t-test are plotted.

Figure 3. (a) Latitude-time cross section of the 25–90-day bandpass-filtered SH index regressed 200 hPa RWS anomalies (shading, unit: 10-10s-2) and T-N flux anomalies (vectors, unit: m2s-2) averaged over 60–120°E from the 30-day lead to the 30-day lag during the El Niño winters. The octagon represents the composite of the 25–90-day bandpass-filtered SH index in the eight phases of the MJO. The solid dots denote significant SH index values above the 95% confidence level based on the two-tailed Student’s t test. The raster fill represents the percentage of the positive 25–90-day bandpass-filtered SH index values around its peak from day −30 to day +30 in the eight phases of the MJO. The blue line denotes the autocorrelation coefficient of the 25–90-day bandpass-filtered SH index. (b) Similar to (a) but for the La Niña winters.
相关文章:
Fang Zhou*, Min Huang, Minghong Liu, Yitian Qian, and Yan Zhu. 2024. Distinct intraseasonal periodicity of Siberian high as modulated by ENSO: dominance of Madden-Julian oscillation.Environmental Research Letters, 19, 064066.