气候变化趋势一直是气象研究中的热点问题之一,但常规观测资料(地面观测站、船舶探测以及探空资料)易受地形、天气等因素限制。1979年卫星微波温度计的出现很大程度上解决了这一问题,它提供了全球、全天候的各层大气温度资料。由于单颗卫星工作寿命有限,故可将多颗卫星上的资料进行融合来计算气候变化趋势。
资料同化研究与应用中心团队的夏新露博士研究生和邹晓蕾教授利用NOAA-15,-18 , -19和MetOp-A, -B卫星搭载的AMSU-A资料,在细致的星间误差订正(双差法)和昼夜观测的日变化订正(傅里叶变换)的基础上(图1),研究了亚马逊地区1998-2017年间的气候线性(图2)和非线性(图3)变化趋势。结果表明亚马逊地区地面到对流层上层温度存在增温趋势,但是增温趋势随着时间出现减缓现象,而平流层温度则是降温趋势,而且降温趋势出现了加强现象。其中利用EEMD方法得到的非线性趋势可以反映在一段时间内更多的气候变化过程:非线性趋势分析结果表明平流层上层温度在1998-2008年间的降温趋势明显强于2008-2017时段;地面温度在2008年之前呈降温趋势,2008年之后才出现显著的升温特征。
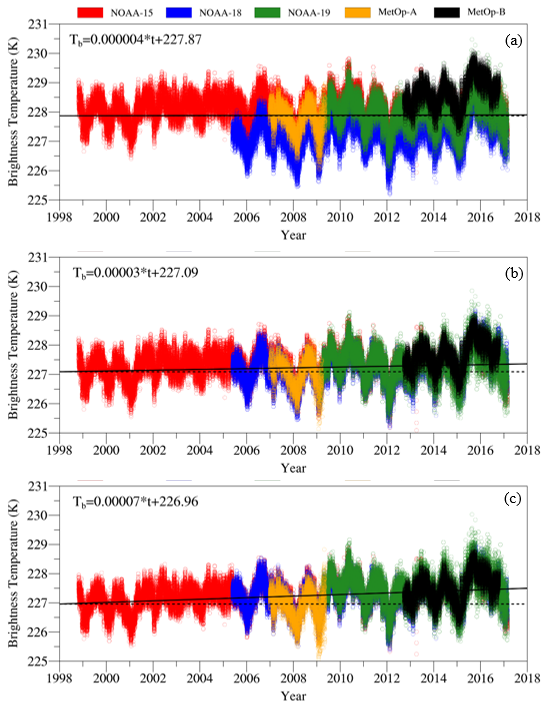
Fig. 1:Time series of AMSU-A channel-7 brightness temperature observations of NOAA-15/-18/-19 and MetOp-A/-B (a) without any correction, (b) with only the inter-sensor bias correction, and (c) with both the inter-sensor bias and diurnal corrections. Black solid curves indicate the linear trend. The black dashed line shows the y-intercept. The regression equations are given in each panel and the unit of t is day.
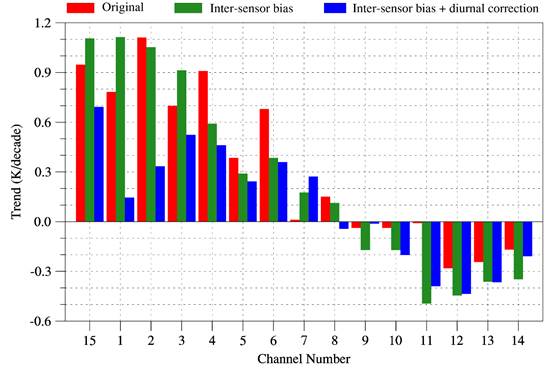
Fig. 2:Decadal linear trends of brightness temperature observations for all AMSU-A channels from NOAA-15/-18/-19 and MetOp-A/-B. Red, green and blue box indicates original, data after inter-sensor bias and data after both inter-sensor bias and diurnal correction.
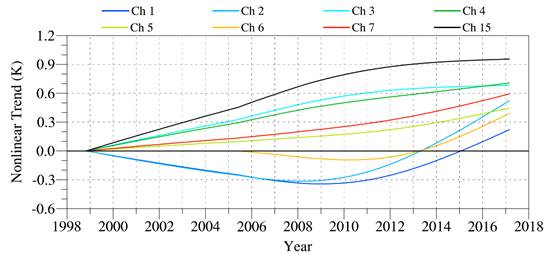
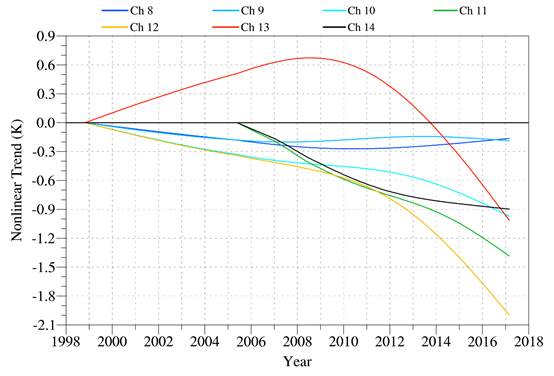
Fig. 3:Decadal nonlinear trends of NOAA-15/-18/-19 and MetOp-A/-B AMSU-A near-nadir brightness temperature observations with diurnal correction for channels 1–7, and 15 (top panel) and channels 8–14 (bottom panel). The EEMD method was applied to daily observations over the Amazon rainforest and also used to remove the annual variation.
研究的详细信息请见:
Xia, X., Zou, X. Impacts of AMSU-A inter-sensor calibration and diurnal correction on satellite-derived linear and nonlinear decadal climate trends of atmospheric temperature. Clim Dyn 54, 1245–1265 (2020).https://doi.org/10.1007/s00382-019-05057-9.